The life cycle of phishing pages
Introduction
In this study, we analyzed how long phishing pages survive as well as the signs they show when they become inactive. In addition to the general data, we provided a number of options for classifying phishing pages according to formal criteria and analyzed the results for each of them.
The resulting data and conclusions could be used to improve mechanisms for re-scanning pages which have ended up in anti-phishing databases, to determine the response time to new cases of phishing, and for other purposes.
Data retrieval method
Websites were selected for this study which our signature anti-phishing engine identified as “phishing” threats from July 19 to August 2, 2021. The engine’s database was monitored once every minute to avoid delays between when a verdict is assigned and uploading the link to the study database. One link was selected from each subdomain in order to maximize the sample range and rule out any outliers. A total of 5310 links were collected. The vast majority of them (5307) led to phishing pages, while the rest led to scam pages.
Over a thirty-day period from the moment a “phishing” verdict was assigned to a page, the analysis program checked each link every two hours and saved the response code issued by the server as well as the text of the retrieved HTML page (or the error log if the page couldn’t be loaded). The content of each page was then compared to its earlier version, focusing on a number of characteristics: the page’s MD5 hash, title, and size. The detailed analysis process is illustrated in the following flowchart:
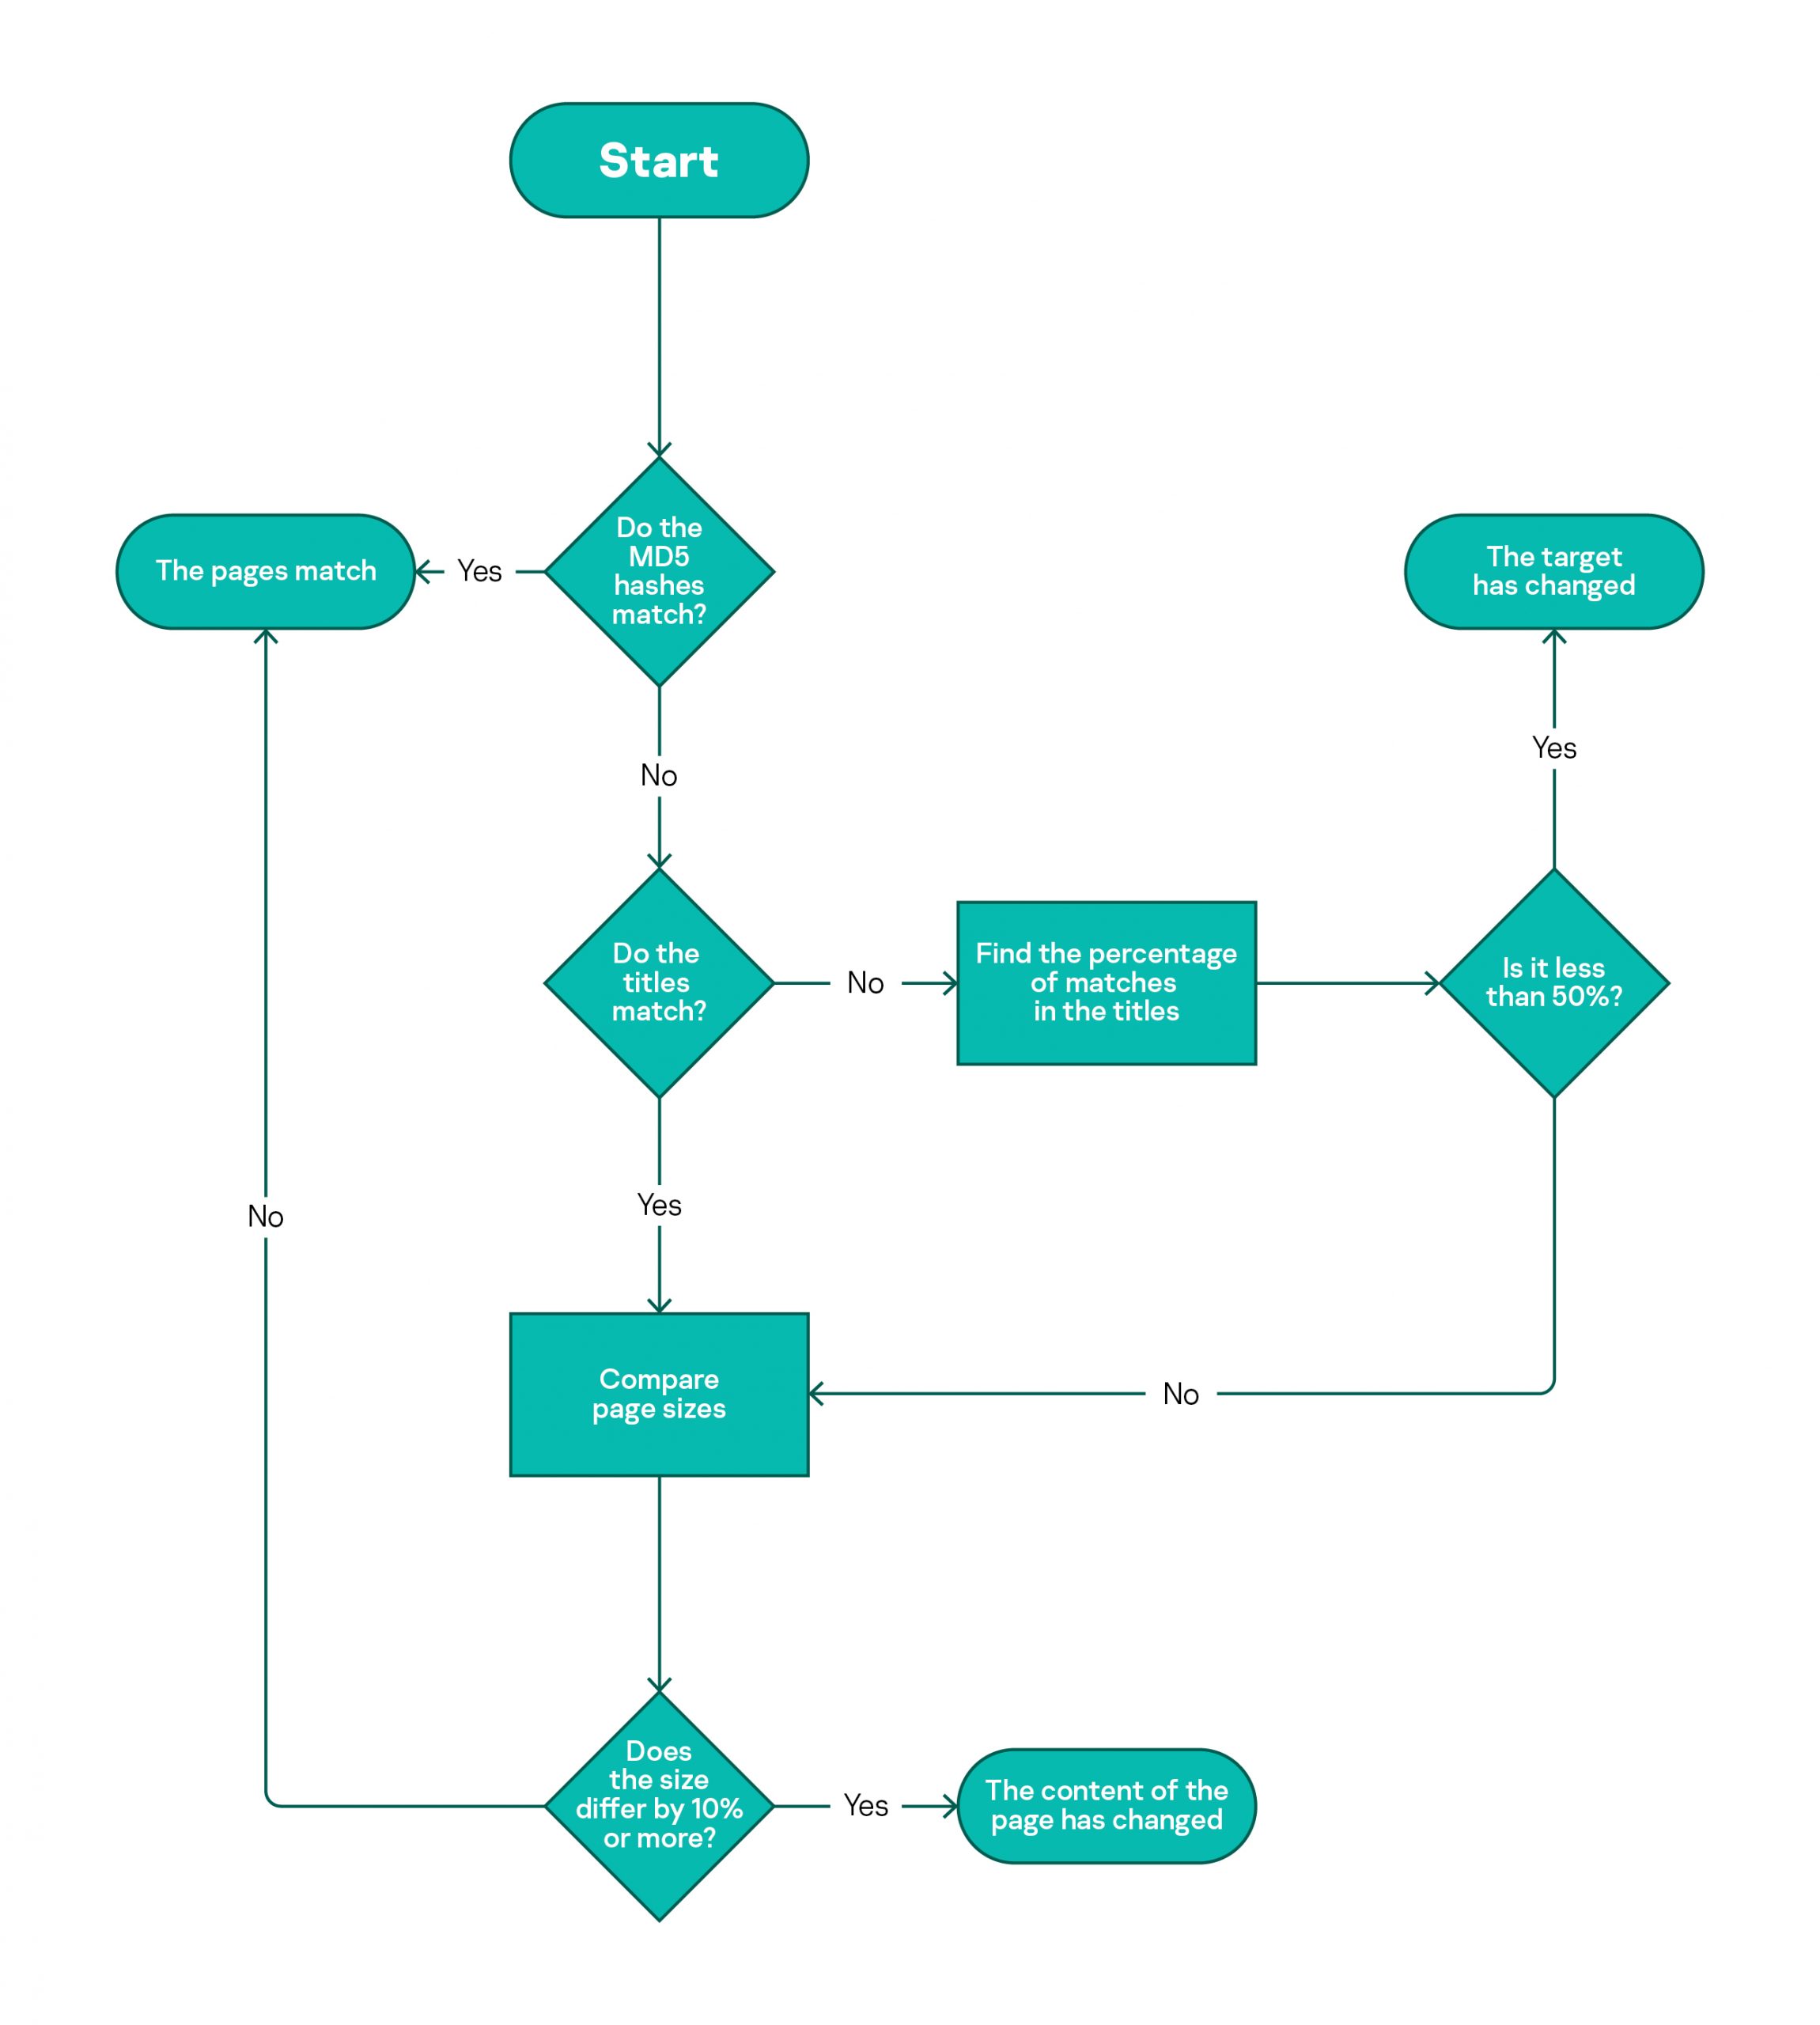
Diagram of how phishing pages were analyzed
Data processing method
The following data was stored for each link at the end of the 30-day period:
- the analysis verdicts assigned according to the flowchart above;
- server response codes;
- error logs;
- page titles with manually assigned labels based on analytics:
-
- the page contains phishing or a scam;
- the page is a hosting stub;
- the page cannot be found or won’t load.
Each item on this list was given a timestamp to represent the number of seconds elapsed from when the link began to be monitored. Using the timestamps, we recorded the data into a table to plot a graph showing the life cycle of each link. This allowed us to track when there was phishing activity on a page.

An example of a graph showing a link’s life cycle. This graph shows the link’s unique identifier (in the graph heading), page titles (in blue) and errors (in red). The days of monitoring are shown on the x-axis
We added together the results of the analysis relative to each timestamp and calculated the number of pages which were still active after a fixed amount of time since they began to be monitored. We also calculated the number of pages which became inactive during this time and the errors they displayed during their last period of inactivity (further referred to as “signs of inactivity”).
General results
Life cycle of phishing pages
The following graph shows the number of days survived by phishing links which became inactive during the 30-day monitoring period. Given that the links were detected by the program on a gradual basis, the graph indicates the relative time each link was monitored as the number of days. A significant number of links (1784) were already inactive after the first day of monitoring.
Classification of phishing links according to the number of active days (download)
At a glance, the classification of links according to the number of hours they survived shows the bulk of phishing pages were only active for less than 24 hours. In the majority of cases, the page was already inactive within the first few hours of its life.
Classification of phishing links according to the number of active hours. The graph presents data for the first five days of each link’s life (download)
In just 30 days, 3,791 (71.4%) of the pages stopped showing signs of phishing activity. Moreover, a quarter of all the pages were already inactive just 13 hours after they began to be monitored, while half of the pages survived for no more than 94 hours.
Signs of end of phishing activity
During this study, we identified the following signs which indicate that the phishing activity on a page has ended:
- Timeout — the domain was successfully translated to an IP address but there was no response from the web server
- Domain name resolution error — the domain couldn’t be translated to an IP address
- No content — the phishing content has been replaced with a “page not found” stub, or there is error 404 when trying to open the link
- Hosting stub — instead of the phishing content, the linked page clearly indicates that the domain is hosted (for example, “account blocked”, “website under reconstruction”, etc.)
- Other — rare signs of inactivity (e.g. a certificate error) or errors which do not allow us to pinpoint what exactly has happened.
The following diagram shows the signs most frequently observed in links included in the study.
Signs indicating end of phishing activity (download)
Change to the phishing page during its life
In most cases, phishing pages remain unchanged throughout their active period, although they can change. For example, the phishers can change the brand name, i.e. the target organization they’re posing as. We monitored changes in the target organization by analyzing the title of the page, as changes in the title most frequently indicated changes in the target.
Another option is to change the page’s code, which we identified by analyzing the size of the page. This is a more appropriate method than analyzing the symbols of the code, as it allows us to filter out pages which contain random variables in their codes. Cybercriminals often use them to avoid getting blocked: the hash sum of the entire page, which anti-phishing engines use to detect similar pages, changes when even the smallest correction is made. Analyzing the size of the page also allows us to quickly process a large number of webpage pairs.
Changes phishing pages underwent during their life (download)
Not one of the pages monitored in this study changed its target organization during its life. The reason could be the fact that many phishing websites use a sequence of symbols in their URLs which aims to resemble the target organization they’re posing as (e.g. amaz0n). This kind of phishing is difficult to reorientate to copy a different organization, and it’s easier for the cybercriminals to create a new phishing page than tweak an existing one.
Classification of phishing pages which changed their content during their life according to their aims (download)
Among phishing pages which have changed their content stand out those imitated prize giveaways from the game PUBG. This could have something to do with the fact that PUBG runs alternating temporary events (“seasons”). Given that cybercriminals want to make their phishing pages convincing and therefore as topical as possible, they periodically change the content of pages to keep up with the new season. Example of a fake PUBG giveaway:
 |
 |
Classification of links according to various criteria
The data presented above allows some general conclusions to be made about the life cycle of modern phishing pages without focusing on specific categories. However, we can learn more about such pages if we group them according to fixed criteria and study how the characteristics of their life cycles differ depending on the group.
We grouped phishing pages according to the following formal criteria:
- Date of the domain creation
- Top level domain (TLD). Some examples are .com or .ru
- Location of the phishing page at the website’s root or in a separate directory
- Domain level where the phishing page is located
Date of the domain creation
We obtained the date of the domain creation from the WHOIS public data. Based on this data, we grouped all the domains into five categories:
- created in June 2021 or later;
- created between June 2020 and June 2021;
- created from June 2015 to June 2020;
- created before June 2015;
- hosting.
Distribution of the collected domains according to their creation date
| Domain creation period | Number of pages | Active after 30 days | Start of the inactivity period | Signs of inactivity | |||||
| Q1* | Q2** | Timeout | Domain name resolution error | No content | Hosting stub | Other | |||
| June 2021 and later | 1011 | 367 | 11 | 195 | 213 | 278 | 43 | 76 | 34 |
| From June 2020 to June 2021 | 993 | 310 | 40 | 208 | 357 | 145 | 117 | 21 | 43 |
| From June 2015 to June 2020 | 622 | 154 | 17 | 87 | 185 | 37 | 168 | 44 | 34 |
| Before June 2015 | 836 | 382 | 45 | 688 | 194 | 34 | 157 | 45 | 24 |
| Hosting | 1337 | 165 | 8 | 24 | 613 | 181 | 55 | 275 | 48 |
*Number of hours elapsed by the time a quarter of the domains in this category have become inactive.
**Number of hours elapsed by the time half of the domains in this category have become inactive.
Time frames were based on the fact that the lifetime of phishing pages on new domains is more dependent on the exact time of their creation than the lifetime of phishing pages on old resources, hence why the length of the periods varies. The “hosting” category combines pages on domains marked as host domains in Kaspersky’s anti-phishing database. A separate category was created for these pages because WHOIS services indicate the second-level domain creation date, whereas hosted phishing pages are usually located on subdomains whose creation dates are unavailable. We were also unable to find the creation date for 511 domains not related to hosting, which is why these pages were disregarded in this section.
Distribution of phishing pages according the creation date (download)
Based on this data, we made a number of observations. Here are the key takeaways:
- Hosted phishing pages become inactive faster than the others. A quarter of the pages survived for no more than 8 hours, and only 12.3% of all pages remained active after 30 days. This has to do with the fact that the cheapest option which requires the least effort is to create a hosted phishing website. Hosting providers offer a free trial period which is usually enough for cybercriminals’ plans, and once time is up on the free trial they can simply create a new page and abandon the old one.
- The most “resilient” pages turned out to be ones created before June 2015: 45.7% of these pages remained active after 30 days. Most of these are old websites hacked by cybercriminals who put phishing content there. These pages are likely to remain active for a long time because they’ve been abandoned by their original creators or are located on servers with outdated software which leaves websites more vulnerable to attacks and their consequences.
- When it comes to newer websites, unsuccessful domain name resolution is a more common sign that activity has stopped, whereas the signs on older websites which most frequently signal the end of a phishing campaign are pages displaying “not found” and 404 errors.
Top-level domain (TLD)
We divided all the top-level domains used into three groups: popular gTLDs (generic top-level domains including com, .org., and .net), cheap gTLDs (.xyz and .top), and ccTLDs (country code top-level domains: .cn, .ru etc.), where we decided to also include gTLDs which didn’t fall under the first two categories (.live, .app, etc.).
Distribution of top-level domains
| Top-level domain | Number of pages | Active after 30 days | Start of the inactivity period | Signs of inactivity | |||||
| Q1* | Q2** | Timeout | Domain name resolution error | No content | Stub | Other | |||
| Popular gTLDs | 2629 | 599 | 13 | 56 | 986 | 404 | 318 | 205 | 117 |
| Cheap gTLDs | 528 | 200 | 11 | 87 | 71 | 207 | 22 | 11 | 17 |
| Other gTLDs and ccTLDs | 2153 | 720 | 17 | 213 | 516 | 183 | 269 | 302 | 64 |
*Number of hours elapsed by the time a quarter of the domains in this category have become inactive.
**Number of hours elapsed by the time half of the domains in this category have become inactive.
Phishing pages most frequently use established well-known domains such as .org and .com. At the same time, the .xyz domain is popular among cybercriminals, which is one of the top-level domains that allows you to register a new domain at a low cost or for free, making it convenient for creating one-day websites.
Classification of phishing pages according to top-level domains used (download)
TOP 10 top-level domains where phishing pages are most frequently found (download)
After 30 days, the lowest percentage of activity (22.8%) was observed among phishing pages on popular old TLDs. Websites which make a large contribution to this figure are “located” on the dynamic domain name service duckdns.org. The owner of any server can link the domain name on duckdns.org to the IP-address of their server for free, which cybercriminals use to quickly create websites.
The largest percentage of unsuccessful domain name resolution cases were found on websites located on cheap domains at a total of 63.1%. The reason is that it is easy to register a new name on these domains which is only attractive for phishing attacks where domain names spell out famous brands with typos. When a website is no longer needed, the owner abandons it and doesn’t renew registration. This means the website disappears from the internet forever.
Location of a phishing page on a website
Phishing pages can be divided into two groups according to where they’re located on a server:
- pages with their files located at the server root, e.g. https://example.com/;
- pages with their files located in a folder (directory), e.g. https://example.com/phishing.
Distribution of phishing pages according to their location
| Page location | Number of pages | Active after 30 days | Start of the inactivity period | Signs of inactivity | |||||
| Q1* | Q2** | Timeout | Domain name resolution error | No content | Stub | Other | |||
| In a directory | 3818 | 1206 | 15 | 157 | 1024 | 497 | 592 | 364 | 135 |
| At the root | 1492 | 313 | 12 | 39 | 648 | 297 | 17 | 154 | 63 |
*Number of hours elapsed by the time a quarter of the domains in this category have become inactive.
**Number of hours elapsed by the time half of the domains in this category have become inactive.
Information about where the files of a phishing page are located can help us determine whether the attackers created a purpose-built website for phishing or hacked one. Setting up a phishing page at the root of a legitimate website may require changing the structure of files on the server and deleting the legitimate website’s content. This can be more problematic than creating a new folder on the server which doesn’t interfere with the website’s other information resources.
Distribution of phishing pages according to where they’re located on a server (download)
The results confirm the assumption made earlier that it’s easier for cybercriminals to create separate directories on hacked websites to achieve their aims: over 97% of the pages which displayed the error “no content” were located in directories. “No content” is an indication that the file has been deleted from the server. More often than not, this occurs when a website’s rightful owner regains access to the website or simply detects a threat and removes the suspect content.
Phishing pages located in directories proved to be more resilient than pages at the root: about 30% of the links remained active over 30 days (compared to 20% of pages at the root). Moreover, half of the phishing links in directories only became inactive after 157 hours, which is four times the activity length observed for pages at the root.
Domain level
Distribution according to domain level
| Domain level | Number of pages | Active after 30 days | Start of the inactivity period | Signs of inactivity | |||||
| Q1* | Q2** | Timeout | Domain name resolution error | No content | Stub | Other | |||
| 2 | 2279 | 569 | 13 | 87 | 641 | 343 | 438 | 181 | 107 |
| 3 | 2248 | 667 | 15 | 99 | 810 | 285 | 144 | 281 | 61 |
| 4+ | 783 | 283 | 15 | 114 | 221 | 166 | 27 | 56 | 30 |
*Number of hours elapsed by the time a quarter of the domains in this category have become inactive.
**Number of hours elapsed by the time half of the domains in this category have become inactive.
The domain level can indicate whether a website is part of a large network such as a hosting service or an independent online entity. When determining the domain level, composite top-level domains (like .co.uk) were counted as one level.
Domains over the sixth level are rare and usually created to trick users by imitating how the real website’s URL is written. An example would be the fictitious website: https://www.google.com.secure.domain.phishing[.]xyz. A user taking a quick glance at the link will see google.com and may not notice this isn’t the full domain name and that the website doesn’t have any connection with Google.
Distribution of phishing pages by domain level (download)
We’ve made several observations based on the data collected. Here are the key takeaways:
- The higher the domain level the more resilient a page is. This is reflected in the percentage of pages which remain active after 30 days as well as the time half of the links took to cease activity.
- The error “content not found” was encountered on pages on third-level (and lower) domains which became inactive. This is further confirmation that not every phishing link below the second level is located on a hosting service.
- The opposite also holds true, i.e. not every page on a second-level domain is located on its own server: hosting stubs are found at this level. This has to do with the fact that you can connect a pre-registered second-level domain when registering a website on a hosting service.
Which combinations of characteristics are encountered most frequently in phishing?
We’ve looked at different ways phishing pages can be classified according to formal criteria. Based on this data, we can now look at the most frequent combinations of characteristics to determine which phishing websites are encountered most often.
Table for frequency of all combinations of characteristics
| Creation date | Location | Domain level | TLD | Quantity | Percentage of pages active after 30 days | Start of the inactivity period | ||
| Q1* | Q2** | Q3*** | ||||||
| Hosting | At the root | 3 | Popular gTLDs | 568 | 6% | 7.33 | 19.51 | 51.91 |
| Before June 2015 | In a directory | 3 | Other gTLDs and ccTLDs | 346 | 75% | |||
| From June 2015 to June 2020 | In a directory | 2 | Popular gTLDs | 302 | 19% | 16.44 | 64.00 | 547.88 |
| June 2021 and later | At the root | 2 | Popular gTLDs | 280 | 29% | 108.03 | 378.69 | |
| From June 2020 to June 2021 | In a directory | 2 | Popular gTLDs | 231 | 19% | 10.85 | 57.24 | 468.23 |
| Hosting | In a directory | 3 | Other gTLDs and ccTLDs | 228 | 16% | 15.14 | 61.97 | 385.16 |
| Before June 2015 | In a directory | 2 | Popular gTLDs | 228 | 16% | 4.67 | 28.97 | 516.28 |
| From June 2020 to June 2021 | In a directory | 3 | Other gTLDs and ccTLDs | 204 | 14% | 208.31 | 212.98 | 446.42 |
| June 2021 and later | In a directory | 2 | Popular gTLDs | 189 | 42% | 14.60 | 228.22 | |
| Hosting | In a directory | 3 | Popular gTLDs | 154 | 14% | 6.87 | 22.64 | 143.15 |
| Hosting | In a directory | 4+ | Other gTLDs and ccTLDs | 148 | 14% | 6.58 | 39.23 | 311.31 |
| From June 2020 to June 2021 | In a directory | 2 | Cheap gTLDs | 130 | 42% | 43.47 | 666.60 | |
| From June 2020 to June 2021 | In a directory | 2 | Other gTLDs and ccTLDs | 121 | 29% | 13.28 | 102.46 | |
| June 2021 and later | In a directory | 2 | Cheap gTLDs | 118 | 37% | 4.17 | 29.19 | |
| Hosting | At the root | 3 | Other gTLDs and ccTLDs | 116 | 25% | 18.12 | 58.30 | |
| From June 2015 to June 2020 | In a directory | 2 | Other gTLDs and ccTLDs | 101 | 15% | 8.33 | 49.97 | 381.56 |
| From June 2020 to June 2021 | In a directory | 4+ | Popular gTLDs | 91 | 57% | 89.99 | ||
| Before June 2015 | In a directory | 2 | Other gTLDs and ccTLDs | 91 | 23% | 15.11 | 82.52 | 685.70 |
| From June 2020 to June 2021 | In a directory | 3 | Popular gTLDs | 86 | 56% | 89.93 | ||
| From June 2015 to June 2020 | In a directory | 3 | Popular gTLDs | 83 | 30% | 19.47 | 98.56 | |
| June 2021 and later | At the root | 4+ | Cheap gTLDs | 77 | 47% | 10.72 | 25.99 | |
| From June 2015 to June 2020 | In a directory | 3 | Other gTLDs and ccTLDs | 73 | 58% | 306.02 | ||
| Hosting | At the root | 4+ | Popular gTLDs | 65 | 5% | 6.63 | 19.57 | 59.16 |
| Before June 2015 | In a directory | 3 | Popular gTLDs | 63 | 17% | 19.01 | 64.99 | 462.00 |
| Before June 2015 | In a directory | 4+ | Other gTLDs and ccTLDs | 60 | 60% | 211.41 | ||
| June 2021 and later | In a directory | 4+ | Popular gTLDs | 54 | 46% | 8.73 | 198.33 | |
| June 2021 and later | In a directory | 3 | Popular gTLDs | 53 | 36% | 6.26 | 145.73 | |
| June 2021 and later | In a directory | 2 | Other gTLDs and ccTLDs | 51 | 31% | 5.38 | 34.63 | |
| June 2021 and later | In a directory | 4+ | Cheap gTLDs | 37 | 46% | 17.44 | 50.01 | |
| June 2021 and later | At the root | 2 | Cheap gTLDs | 36 | 19% | 13.90 | 51.05 | 531.54 |
| Hosting | In a directory | 4+ | Popular gTLDs | 32 | 25% | 11.04 | 49.51 | |
| From June 2020 to June 2021 | At the root | 3 | Other gTLDs and ccTLDs | 29 | 31% | 32.24 | 51.85 | |
| Before June 2015 | At the root | 3 | Popular gTLDs | 27 | 44% | 18.99 | 324.53 | |
| From June 2020 to June 2021 | In a directory | 4+ | Other gTLDs and ccTLDs | 26 | 46% | 48.05 | 521.60 | |
| Hosting | At the root | 4+ | Other gTLDs and ccTLDs | 25 | 52% | 21.30 | ||
| From June 2020 to June 2021 | In a directory | 3 | Cheap gTLDs | 25 | 44% | 167.61 | 296.23 | |
| June 2021 and later | At the root | 2 | Other gTLDs and ccTLDs | 22 | 45% | 7.27 | 11.87 | |
| June 2021 and later | At the root | 3 | Cheap gTLDs | 22 | 27% | 7.05 | 31.89 | |
| From June 2020 to June 2021 | At the root | 4+ | Other gTLDs and ccTLDs | 20 | 40% | 15.14 | 31.68 | |
| June 2021 and later | At the root | 3 | Popular gTLDs | 19 | 37% | 34.78 | 154.85 | |
| June 2021 and later | In a directory | 3 | Cheap gTLDs | 18 | 28% | 7.64 | 36.86 | |
| June 2021 and later | In a directory | 3 | Other gTLDs and ccTLDs | 15 | 40% | 11.24 | 243.49 | |
| From June 2015 to June 2020 | In a directory | 4+ | Other gTLDs and ccTLDs | 11 | 73% | |||
| From June 2015 to June 2020 | In a directory | 4+ | Popular gTLDs | 10 | 10% | 2.74 | 25.56 | 158.22 |
| From June 2015 to June 2020 | At the root | 3 | Popular gTLDs | 9 | 22% | 43.02 | 76.00 | 123.16 |
| From June 2020 to June 2021 | At the root | 2 | Popular gTLDs | 9 | 22% | 7.33 | 22.25 | 182.08 |
| Before June 2015 | At the root | 4+ | Popular gTLDs | 9 | 22% | 118.93 | 238.08 | 455.16 |
| June 2021 and later | In a directory | 4+ | Other gTLDs and ccTLDs | 8 | 63% | 98.25 | ||
| From June 2015 to June 2020 | At the root | 2 | Popular gTLDs | 8 | 38% | 19.54 | 19.58 | |
| From June 2015 to June 2020 | At the root | 4+ | Cheap gTLDs | 8 | 13% | 58.43 | 193.22 | 667.15 |
| From June 2015 to June 2020 | In a directory | 2 | Cheap gTLDs | 6 | 50% | 26.95 | ||
| From June 2015 to June 2020 | In a directory | 3 | Cheap gTLDs | 6 | 33% | 25.21 | 95.27 | |
| From June 2020 to June 2021 | At the root | 3 | Popular gTLDs | 6 | 0% | 68.50 | 80.72 | 112.21 |
| Before June 2015 | In a directory | 4+ | Popular gTLDs | 6 | 0% | 4.26 | 42.06 | 101.38 |
| June 2021 and later | At the root | 4+ | Popular gTLDs | 5 | 20% | 20.85 | 124.47 | 125.83 |
| June 2021 and later | At the root | 3 | Other gTLDs and ccTLDs | 4 | 50% | 25.01 | ||
| From June 2020 to June 2021 | At the root | 2 | Other gTLDs and ccTLDs | 4 | 25% | 17.24 | 368.73 | |
| June 2021 and later | At the root | 4+ | Other gTLDs and ccTLDs | 3 | 0% | 5.43 | 8.43 | 8.58 |
| From June 2020 to June 2021 | In a directory | 4+ | Cheap gTLDs | 3 | 0% | 6.26 | 6.26 | 169.68 |
| Before June 2015 | At the root | 4+ | Other gTLDs and ccTLDs | 3 | 0% | 103.34 | 111.88 | 130.09 |
| From June 2015 to June 2020 | At the root | 4+ | Other gTLDs and ccTLDs | 2 | 50% | |||
| From June 2020 to June 2021 | At the root | 2 | Cheap gTLDs | 2 | 50% | |||
| From June 2020 to June 2021 | At the root | 3 | Cheap gTLDs | 2 | 0% | 193.85 | 195.71 | 197.58 |
| From June 2020 to June 2021 | At the root | 4+ | Popular gTLDs | 2 | 0% | 39.72 | 60.07 | 80.43 |
| From June 2020 to June 2021 | At the root | 4+ | Cheap gTLDs | 2 | 0% | 14.58 | 15.39 | 16.20 |
| Before June 2015 | At the root | 2 | Popular gTLDs | 2 | 0% | 60.89 | 115.05 | 169.21 |
| Hosting | In a directory | 2 | Other gTLDs and ccTLDs | 1 | 100% | |||
| From June 2015 to June 2020 | At the root | 3 | Cheap gTLDs | 1 | 100% | |||
| From June 2015 to June 2020 | At the root | 3 | Other gTLDs and ccTLDs | 1 | 100% | |||
| From June 2015 to June 2020 | At the root | 4+ | Popular gTLDs | 1 | 0% | 61.91 | 61.91 | 61.91 |
| Before June 2015 | At the root | 2 | Other gTLDs and ccTLDs | 1 | 0% | 389.37 | 389.37 | 389.37 |
| Hosting | In a directory | 2 | Popular gTLDs | 0 | 0% | |||
| Hosting | In a directory | 2 | Cheap gTLDs | 0 | 0% | |||
| Hosting | In a directory | 3 | Cheap gTLDs | 0 | 0% | |||
| Hosting | In a directory | 4+ | Cheap gTLDs | 0 | 0% | |||
| Hosting | At the root | 2 | Popular gTLDs | 0 | 0% | |||
| Hosting | At the root | 2 | Cheap gTLDs | 0 | 0% | |||
| Hosting | At the root | 2 | Other gTLDs and ccTLDs | 0 | 0% | |||
| Hosting | At the root | 3 | Cheap gTLDs | 0 | 0% | |||
| Hosting | At the root | 4+ | Cheap gTLDs | 0 | 0% | |||
| From June 2015 to June 2020 | In a directory | 4+ | Cheap gTLDs | 0 | 0% | |||
| From June 2015 to June 2020 | At the root | 2 | Cheap gTLDs | 0 | 0% | |||
| From June 2015 to June 2020 | At the root | 2 | Other gTLDs and ccTLDs | 0 | 0% | |||
| Before June 2015 | In a directory | 2 | Cheap gTLDs | 0 | 0% | |||
| Before June 2015 | In a directory | 3 | Cheap gTLDs | 0 | 0% | |||
| Before June 2015 | In a directory | 4+ | Cheap gTLDs | 0 | 0% | |||
| Before June 2015 | At the root | 2 | Cheap gTLDs | 0 | 0% | |||
| Before June 2015 | At the root | 3 | Cheap gTLDs | 0 | 0% | |||
| Before June 2015 | At the root | 3 | Other gTLDs and ccTLDs | 0 | 0% | |||
| Before June 2015 | At the root | 4+ | Cheap gTLDs | 0 | 0% | |||
*Number of hours elapsed by the time a quarter of the domains in this category have become inactive. The graph has been left empty if not enough domains ceased activity within 30 days.
**Number of hours elapsed by the time half of the domains in this category have become inactive. The graph has been left empty if not enough domains ceased activity within 30 days.
***Number of hours elapsed by the time three quarters of the domains in this category have become inactive. The graph has been left empty if not enough domains ceased activity within 30 days.
Phishing pages are most frequently located at the root of a hosted third-level domain on a popular top-level domain (over 11% of all links), where there is a high level of correlation within the combination of characteristics: when we see a phishing page is located at the root of the domain, the website is hosted with a third-level domain in more than half of cases. As a rule, these pages only tend to be active for an extremely short period of time — 75% of links become inactive after two days.
The majority of websites created from June 2020 to June 2021 use the domains .com, .org, .net and .info. Not only does this category include new websites which have been hacked — it also includes websites which were purpose-built by cybercriminals. Pages which stand out in this category are fake e-payment forms targeting users to steal their bankcard details. These pages can be parts of fraudulent websites or separate websites. There are so many bogus websites with links to certain fake payment pages that these pages make it into Alexa Top 1 Million popularity ranking. An example of an “e-payment” website:

The domains created in the summer of 2021 are predominantly second-level domains. As a rule, the latest websites blocked by Kaspersky products have been specially created for phishing. These one-day websites usually don’t have an extensive system of devices on the network so they don’t need subdomains, which is why attackers stop at the second-level domain.
The second most popular combination is a phishing page located in a directory on a third-level domain created before June 2015. This is the most resilient type of phishing page: just under a quarter of these pages stopped showing signs of phishing activity within 30 days, which is significantly lower than the average figure.
A more detailed analysis of the links in this category revealed almost all of them use the same second-level domain and have similar randomly generated third-level domain names. In these cases, the website presumably fell victim to a cyberattack, where hackers gained access to it and created multiple subdomains without touching the main website’s content.
Conclusion
We’ve looked at the key stages in the life cycle of a phishing page: its creation, changes in content, and end of activity. Based on the results of the study, we’ve drawn the following conclusions:
- The majority of phishing pages are active for a short period of time: half of the links were already inactive within less than a week after detection.
- Modern phishing pages rarely change: not one of the monitored pages changed its target organization within its lifetime. Major changes to content were primarily observed on pages targeting players of an online game which run regular offers and giveaways. Cybercriminals have to adapt their phishing pages to keep up with these offers and make the pages as convincing as possible.
- On average, just under half of the pages displayed a timeout as a sign of inactivity. Other popular signs included unsuccessful domain name resolution, no content and hosting stubs.
- Almost a third of links led to hosted sites — this was the category of links that were active for the shortest amount of time. In some cases these websites only existed for a few hours.